The content of this Space is not the latest version of WBS Gantt-Chart for Jira.
We have separate Space for each version of the product. If the version you are using differs from the one in this Space title, please find the correct one from the below page.
https://ricksoft-support.atlassian.net/wiki/spaces/WGC/overview
You are viewing documentation for WBS Gantt-Chart for Jira Server and Data Center. For Cloud, see WBS Gantt-Chart for Jira Cloud.
If you notice that the content is incorrect, please report it here.
Analytics settings
Select Analytics from the setting screen for system administrators.
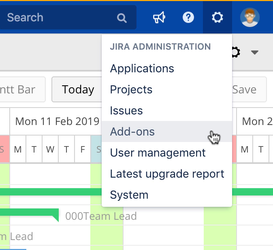
How to access the settings screen for system administrators
About analytics settings
WBS Gantt-Chart for Jira aggregates statistical data on product usage and sends this data to Ricksoft's servers for the purpose of improving our products.
The data collected by Ricksoft is as follows. It does not include any business or personally identifiable information.
- Server identifier (random string uniquely generated by WBS Gantt-Chart for Jira)
- Date of transmission
- Jira version
- Number of active Jira users
- Usage status of certain user settings (statistical data)
The most recently transmitted data can be checked on the analytics screen. Data is collected once a week.
To stop sending statistical data
To stop sending statistics, simply turn the Send statistical data button to "Off."
